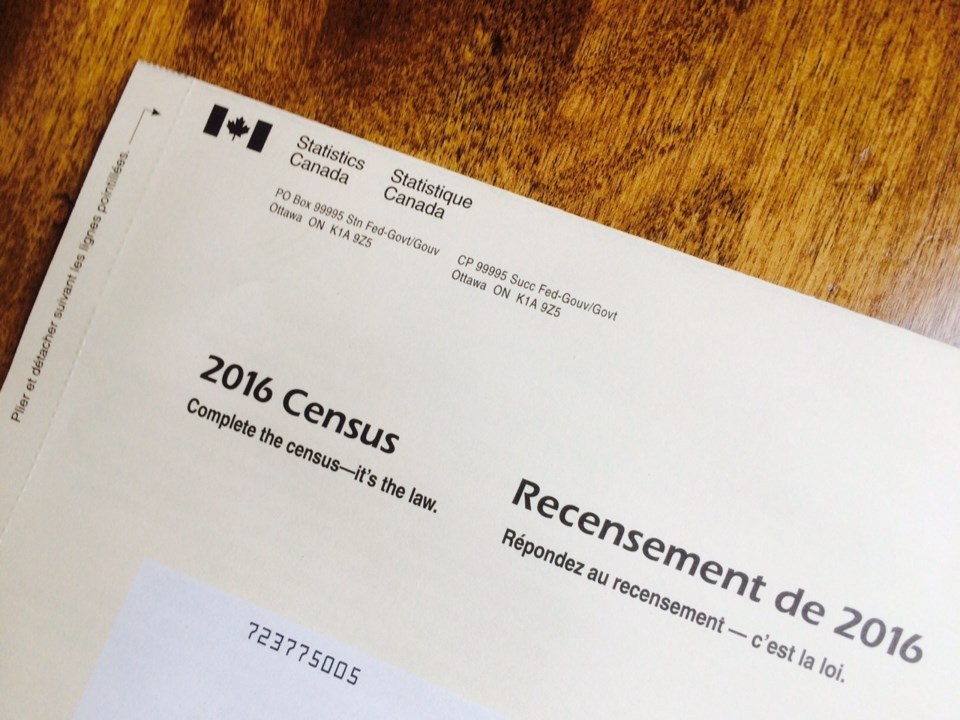
North Bay, Ontario: Information Communication Development Networks (ICTN’s) throughout Northern Ontario are eagerly awaiting the new data to be made available through the 2016 Census that Canadians have filled out this week.
Blue Sky Net, based out of North Bay Ontario has developed an interactive broadband map based partially on Census data in order to analyze the extent of coverage in communities throughout all of Northern Ontario. Currently the map uses Census data from 2011, which has quickly become dated.
“Northern Ontario is divided into a little more than 18,000 geographic units called “Dissemination Blocks” explains Susan Church, Executive Director of Blue Sky Net. “Dissemination Blocks are the smallest division Statistics Canada releases data on.”
Dissemination Blocks (DBs) contain population and dwelling counts and vary in size depending on population density. Blue Sky Net’s broadband map (BAIMAP) “layers” coverage information on a GIS, submitted by Internet Service Providers with the Census information in order to determine which communities are well served and which they believe needs improvement. They plan on updating this map in conjunction with Census data to see changes over time.
“The Government of Canada has done a great job of explaining why Census Data is important in decision making and planning, our broadband coverage map is a real, tangible example of that. I think everyone in a rural communities certainly understands that” says Church.
According to their analysis from the previous Census, the non-profit organization believes that approximately 72% of all households have access to adequate and economical broadband services, the remainder either have an internet connection that is too slow to keep pace with modern demands or too expensive when compared to average pricing.
“It’s definitely an urban/rural divide. I think, and the CRTC has recently come out and said that over 90% of all Canadian households have adequate access. I think that’s likely true but those numbers don’t really illustrate the challenges in more rural communities. Most of our population in this country live in cities which are easier to serve with sustainable infrastructure because you have lots of users in a small space.” says Church. “The further you drill down into areas like Northern Ontario, population density goes way down so the economics to provide high speed services changes along with that.”
Interested individuals can go to www.connectednorth.ca to see for themselves how the 2011 Census data is used through a variety of community report cards and interactive and static maps all based on Census data.
“We know area ISPs are doing their best to fulfil the need out there for improved connectivity. Current data is needed to provide a measurement tool as well as to help focus where investment is needed. Current Census data is a critical part of this.”


