Navigation is not just about which way you need to go; it is also about understanding where you are on the back roads.
Last week, we took on a little navigation schooling when we looked at latitude and longitude with degrees, minutes and seconds. This week, we look at the Universal Transverse Mercator (UTM), which is easier to learn as we are dealing with metres and kilometres, and a mapping tool to boot.
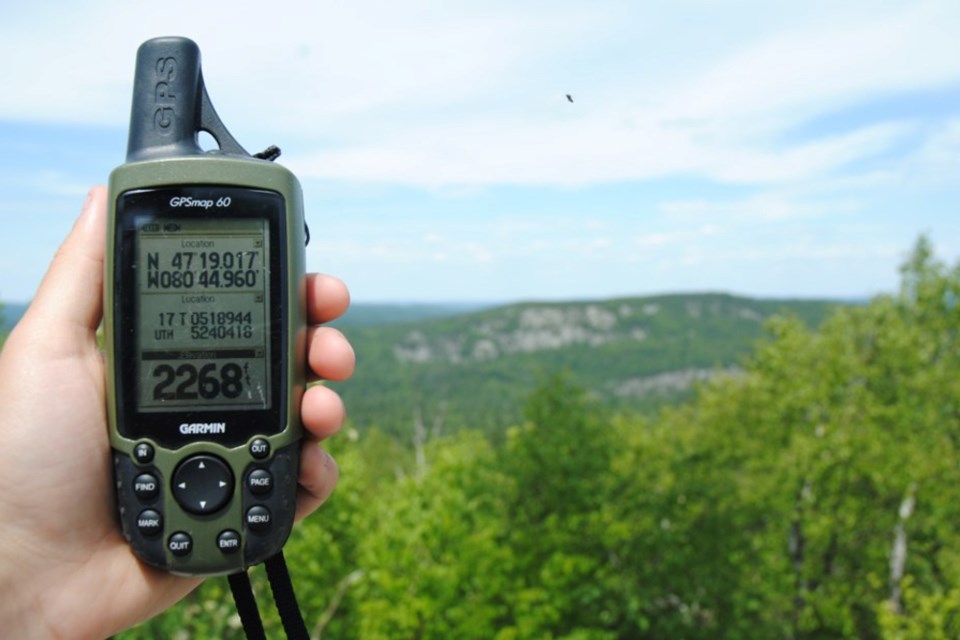
Our position in the world is relative, something that has been known for a long time. Within the Back Roads Bill stories, there are always location coordinates, like this: Zone 17 T E 663576 N 5129113 and N 46° 17.870' Long. W 78° 52.567'. And these coordinates are important to how you effectively and efficiently navigate.
What if you are somewhere with no landmarks? Longitude and latitude and the UTM are the modern conventions that are used to explain where we are relative to a fixed-line. For some time now I have been asked to explain this in easier terms.
Universal Transverse Mercator (UTM)
If you are on land and understand metres UTM is the way to go. It is all about playing the board game Battleship.
UTM is another grid system, like “lat./long.” that describes a person’s location. It is wonderfully simple to understand and use because it is intuitive – its concepts can be understood quickly and a location on a map can be quickly determined with the vertical and horizontal lines.
Because of its simplicity, UTM is becoming the principal grid system for outdoor enthusiasts and Search and Rescue (SAR).
A navigation grid is a reference system developed by cartographers that can be used to plot a geographic position on a map. The UTM system is just like a Cartesian Grid, with “X” and “Y” coordinates [(x,y), remember that in Grade 8]. Back to class we go.
Gerardus Mercator invented this 500 years ago, the concept is not a new technical innovation. He was a mathematician and cartographer. He is best known for his new projection which represented sailing courses of constant bearing as straight lines. He was the first to use the term "atlas" for a collection of maps.
To understand how this projection works, imagine the Earth as an orange with all geographical features already drawn in. Now imagine taking a knife and, after slicing off small circles at the poles, making a straight north-south cut in the peel of the orange and repeating this north-south cut, at equal intervals, until 60 strips or zones have been detached.
Each of these zones will then form the basis of a separate map projection. The flattening may be envisioned by again considering the detached zone as a strip of orange
peel placed on a level surface. By depressing its centre, one could force the peel to flatten until all of it touches the smooth surface. This flattening action results in a slight distortion of the geographical features within the zone, but because the zone is relatively narrow, the distortion is small and may be ignored.
Because the globe is 360° in circumference, a division into sixty vertical zones gives each zone a width of 6° of longitude. By international usage, these zones have been numbered 1 to 60. Sixteen of the zones, bearing numbers 7 to 22, cover Canada. The rectangular-like zone 17T covers an approximate north-south area, south of Timmins, southwards to south of Windsor; and westwards to almost Sault Ste. Marie and east to near Bissett Creek, east of Mattawa.
The grid works
All vertical lines run parallel to the central meridian of each zone, i.e., the meridian that runs down the centre of each zone exactly three degrees of longitude from either side. All horizontal lines run parallel to the equator. We must be mindful here that the parallels of latitude shown on our UTM maps are not quite parallel to the equator, or to each other, because they are slightly distorted by the flattening. The equator itself is not distorted by the Mercator projection.
Horizontal lines are designated by their distance from the equator in metres. Because Canada's southernmost point is about 4,620,000 metres (divide by 1000 m, 4,620 km – that makes sense) from the equator, all horizontal lines in Canada have a 'northing' value above that figure. Vertical lines are measured from a separate point for each zone, namely, an imaginary, middle line lying 500,000 metres west of the zone's central meridian. Zones never attain the full width of 1,000,000 metres which such a measurement suggests. In fact, in northern Canada, zone widths shrink to as little as 80,000 metres (40,000 metres on either side of the central meridian). In practice, this means that vertical lines are counted from the central meridian or 500,000-metre line, those to the left of it having an 'easting' value of less than 500,000 metres, and those on the right having a value above that. Don’t worry about this, just think the zones are like rectangles with a middle, constant line.
The number of metres north of the equator represented by the bottom horizontal grid line on a topographic map is always shown in the lower left-hand corner of the map. Similarly, the number of metres east of the zero vertical line represented by the left vertical grid line is also shown in the lower left-hand corner.
If a given point on a map is positioned exactly at the intersection of a vertical and horizontal line, its location may be read off simply from the map margins. Its full designation or its "coordinates" would include the zone number, followed by the easting and northing values. On a 1,000-metre grid, these coordinates might read Zone 18 T, E 357000, N 5476 000. The values of the first vertical and horizontal lines appearing in the southwest corner of a topographic map are given in full. The other grid lines are numbered in an abbreviated fashion. Your GPS will also tell you what zone you are in.
Coordinate details
Few points are conveniently located at grid intersections. Usually, the point to be described is somewhere between lines. In this case, it is necessary to measure or estimate the distance to the nearest vertical line to the west and to the nearest horizontal line to the south and to add these metric values to the grid values given at the margin of the map.
If a point is located 400 metres East (Easting) of the vertical line of 357,000, and 200 metres North (Northing) of the horizontal line of 5,476,000, its coordinates would be Zone 14 T, E 357400, N 5476200. With these three numbers, any point in the northern hemisphere can be unmistakably identified. There is a similar reference in the southern hemisphere, but confusion never results from this; Northings remain as Northings.
What do really need to know? The zone you are within the 60 zones. Your map and GPS unit will always show this.
The civilian system of designating UTM Grid coordinates is straightforward and, since it uses only numbers, it can be handled by digital mapping software and Geographic Information Systems (GIS), an important consideration with any kind of technical data. These are absolute numbers and fit nicely in a spreadsheet.
The beauty of the UTM rectangular grid is that by using a brief code consisting of the zone and grid-line numbers it is possible to identify any point even if that point is not otherwise marked or identified on any map. The UTM and longitude and latitude are marked on standard topographic maps for identifying points with reference to the rectangular grid and tick marks. The 1000 m grid (1:50 000 standard topo. map) is for UTM and charts (not maps) have longitude and latitude.
In summary, I recommend UTM coordinates because it avoids the formatting uncertainty of lat./long. and is better suited ground references. It is easier to translate to paper maps, defining areas and calculating distances. Here is a video tutorial.
And if you are ever in the situation where you need to report your coordinates to emergency responders, ask the person on the other end to repeat back what you’ve just told them. Getting a digit wrong may wind up far away from your actual location.
My maps
As a bonus to all of this, one of the best ways to make and communicate a map link is with the free Google app called My Maps which is not Google Earth or Google Maps.
It is a web-based mapping tool that allows you to create custom maps by marking specific locations, adding text, images, and videos, and sharing them with others. Easy.
You can create a My Maps link like the map link in this Village Media story that has more than 38,000 views.
Here is a short My Maps tutorind comes highly recommended. Another skill to master. And for your pre-planning purposes you can then share the finished map link with others. You will be safer.
The two questions on the back roads are: “Where am I?” and “Where am I going?” If you can’t provide locations for either you are either lost or confused. Point yourself in the right direction. Oh yes, did I mention knowing the basics of a compass are important? And that’s before you pick up your GPS.
Back Roads Bill Steer is the founder and remains as the GM of the Canadian Ecology Centre. He teaches part-time at Nipissing University (Schulich School of Education) and Canadore College. Contact him at [email protected] ; go to www.steerto.com and follow him on Facebook, Instagram (backroads_bill) and Twitter (@steertonorthONT). His features are found throughout the Village Media network on the weekends.
-30-


